

# Debug
WARNING
weex-toolkit is a third party plugin, and is not developed nor maintained by Apache Weex.
This document focuses on how to use the debugging tools built into weex-toolkit for code debugging.
# Installation
First you need to install the weex-toolkit tool via npm or yarn
$ npm i weex-toolkit@beta -g
$ weex -v // check if the installation is successful
# Run
After the installation is complete, run the weex debug command to start the debug console. After running, the program will automatically open the following interface:

If you have a page that needs to be compiled, you can also compile it with the weex debug [ folder | file ] command. If you run weex debug src, the compiled page will be displayed under the page tab. Shown as follows:

# Start debugging
TIP
Before debugging, please make sure that the mobile phone with the debugging application is on the same LAN as the PC, and disable the proxy settings such as VPN. Otherwise, the debugging will not be performed normally. At the same time, when using the function, try to ensure that other functions are disabled. If you use the JS Debug function to turn off the Network function, you will have a better development experience.
Debugging requires the use of an integrated Weex debugging tool for code scanning and debugging. For related documents, please refer to:
[1] Android Weex Detool Integration Document.
[2] iOS Weex Detool integration documentation.
You can also use the Playground App provided by Weex to debug your code. For the download address, see Weex Playground.
Go back to the debug QR code page and use the scan code function of the application to scan the code to enter the debug console, as shown in the figure:
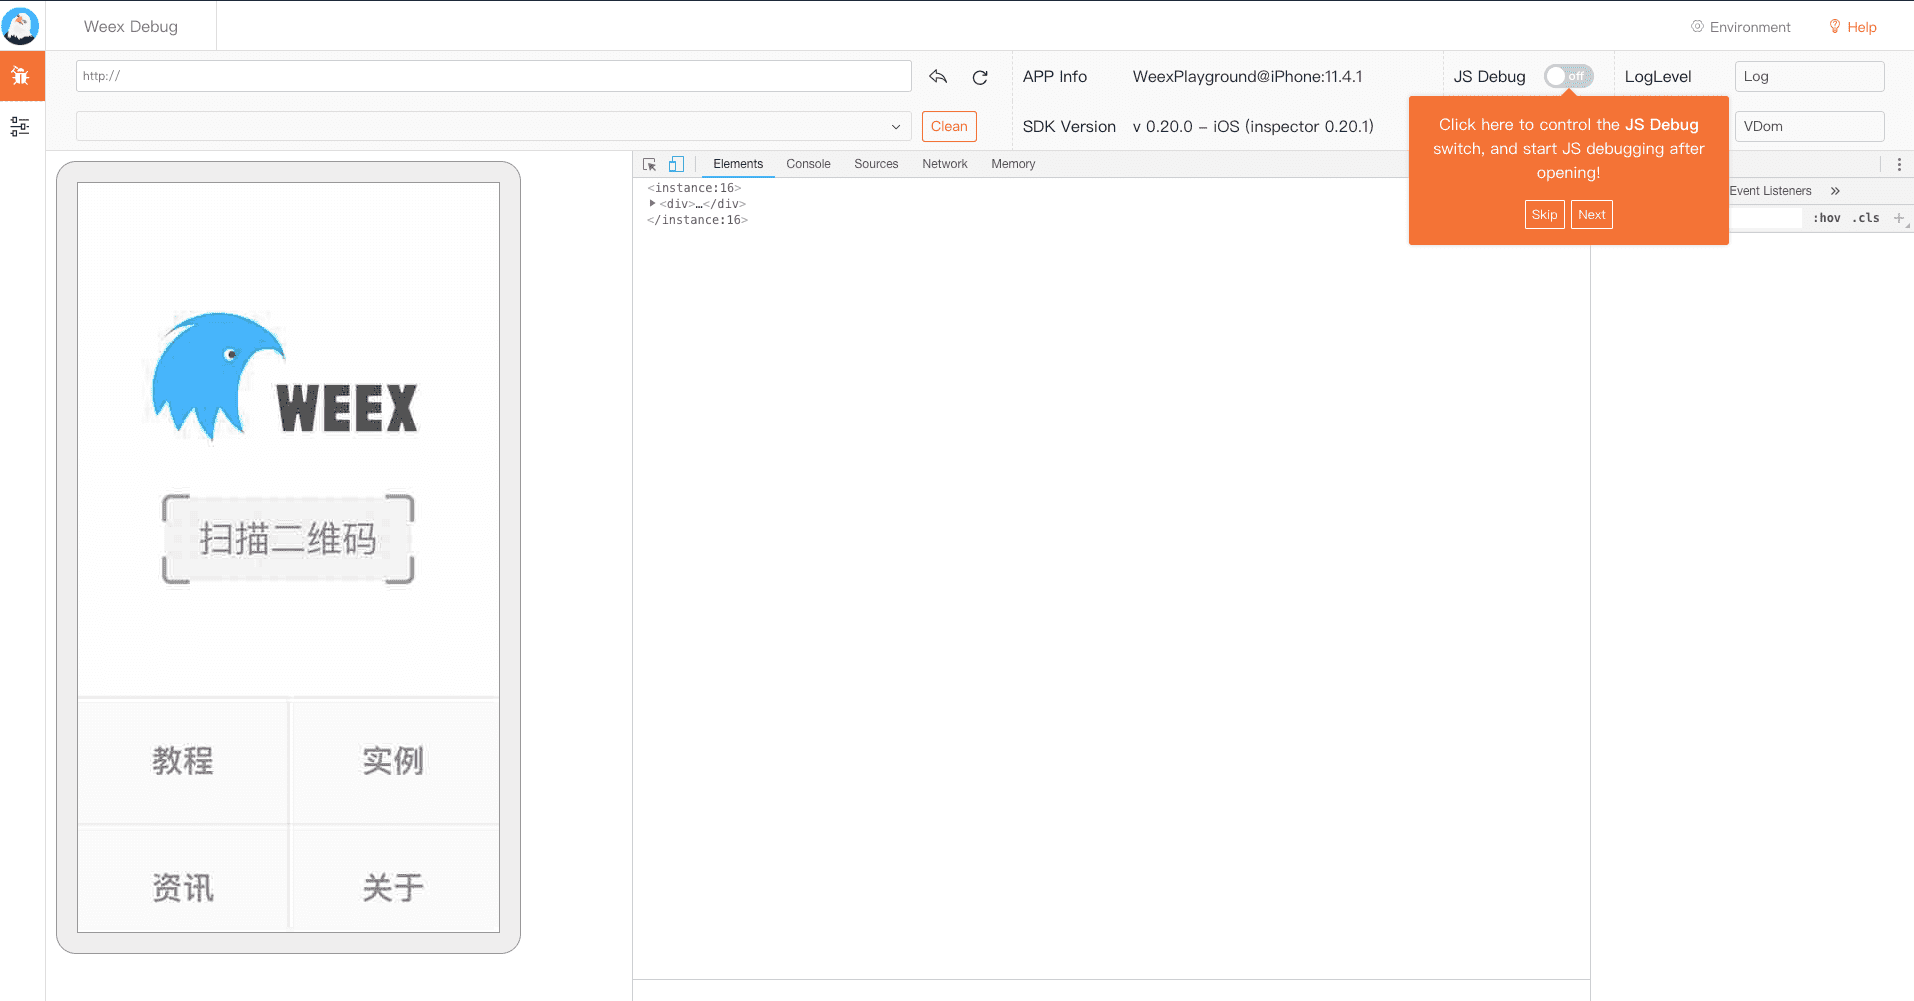
The first time you enter the debugging interface, there will be a prompt interface to guide you to understand the related functions that will be used during debugging. For developers who use the debugging tool for the first time, it is recommended to read all the prompts completely.
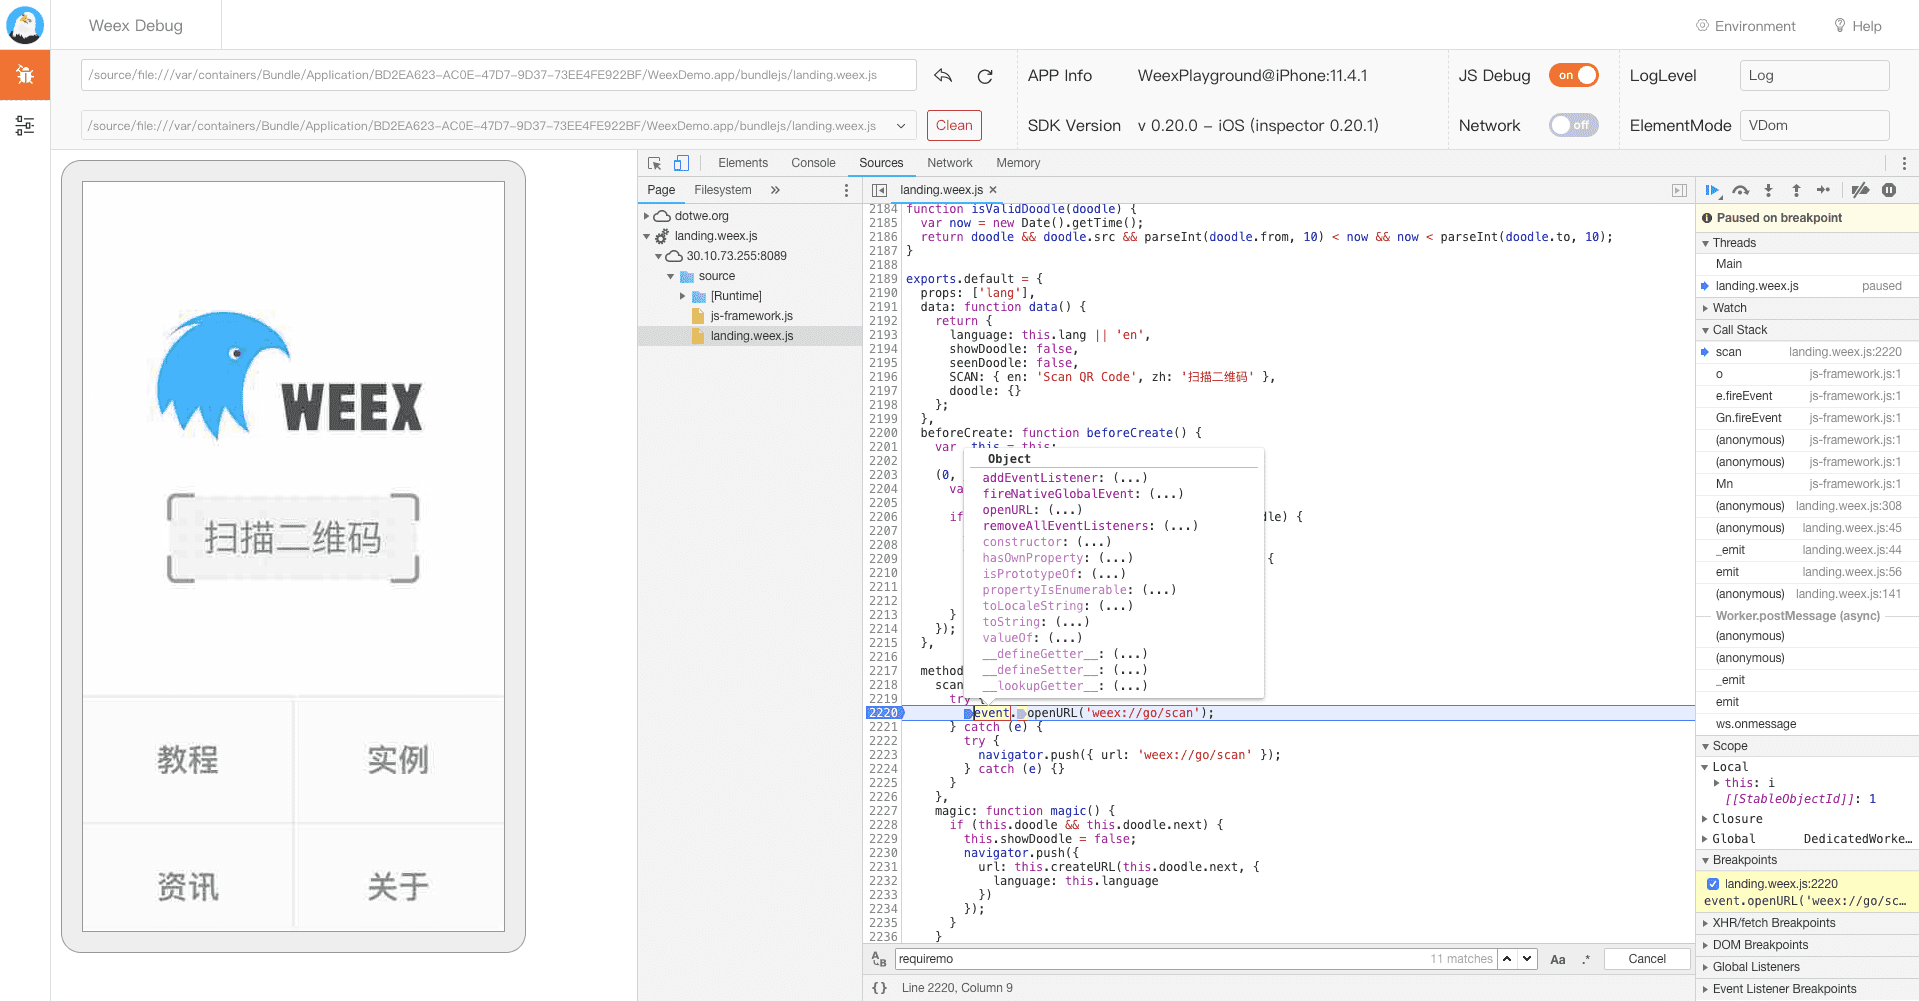
# JS debug
Open the JS Debug function to enter the Weex code debugging mode as shown, you can find the source code on the Source panel:
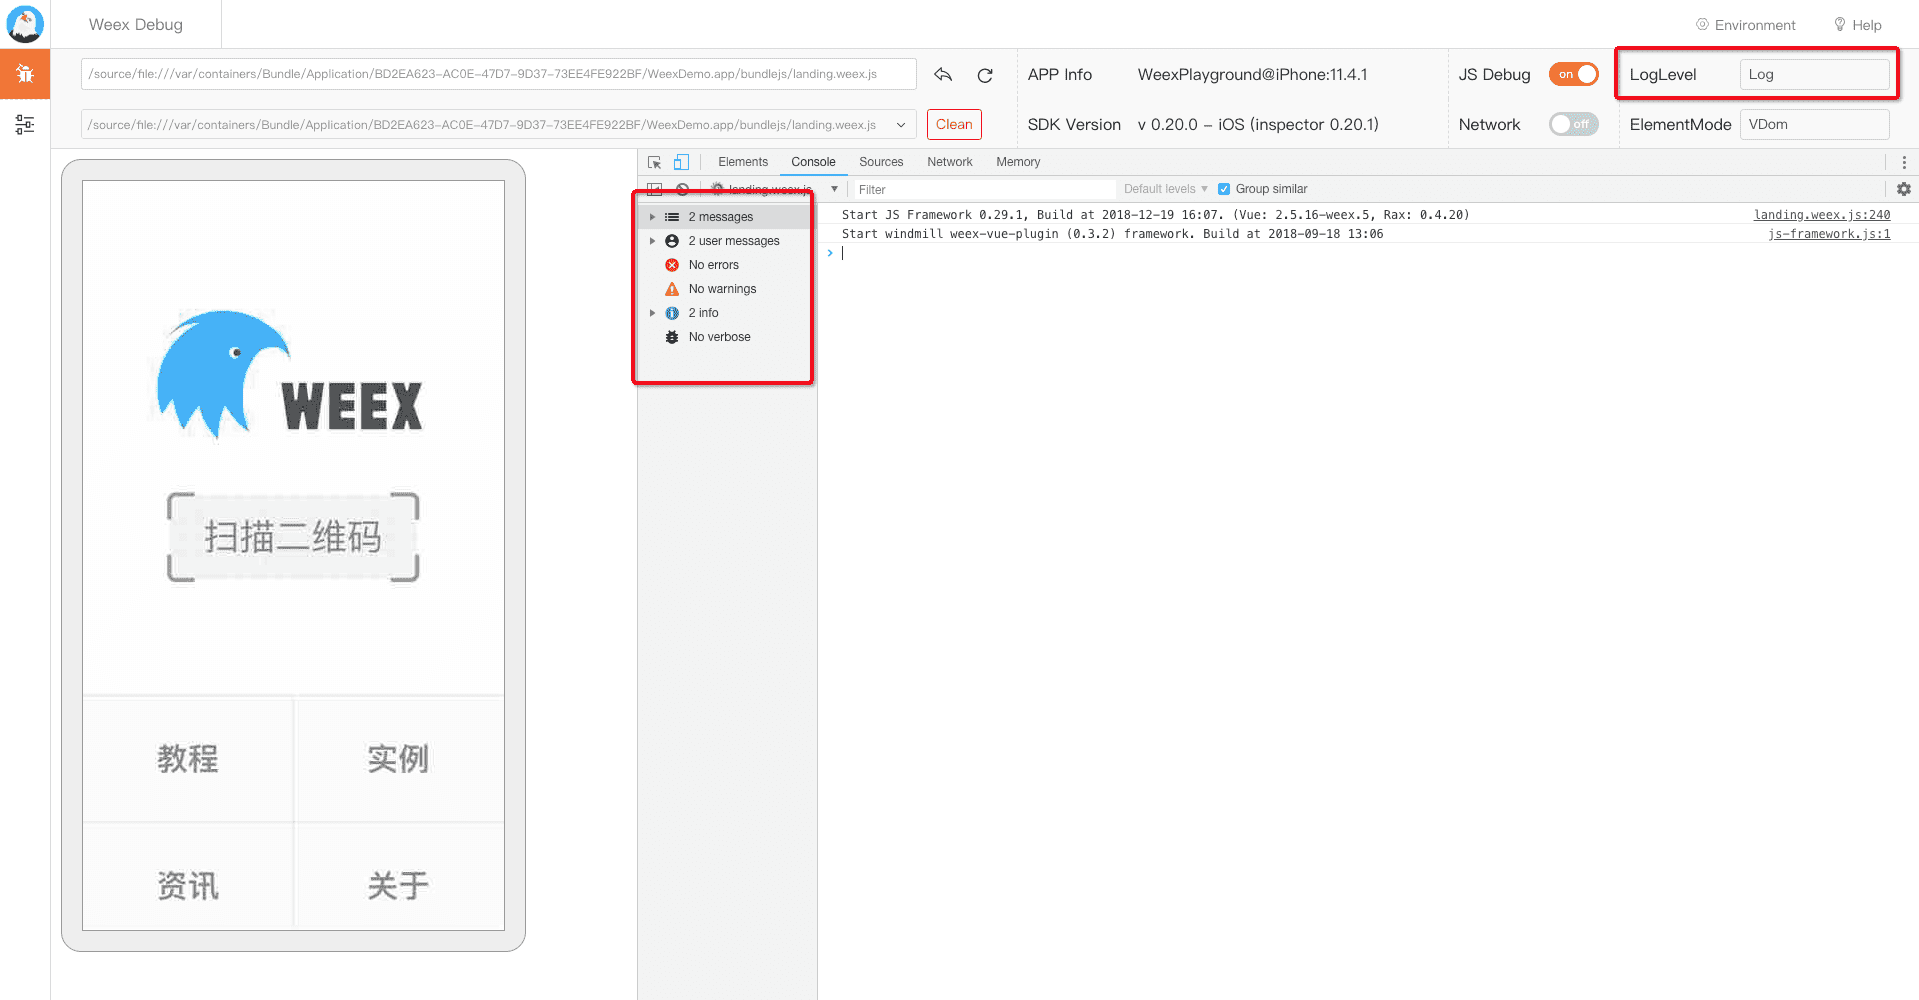
# Loglevel
Filter and filter the logs through the console and LogLevel options, and keep the log content you are concerned with, as shown in the figure:
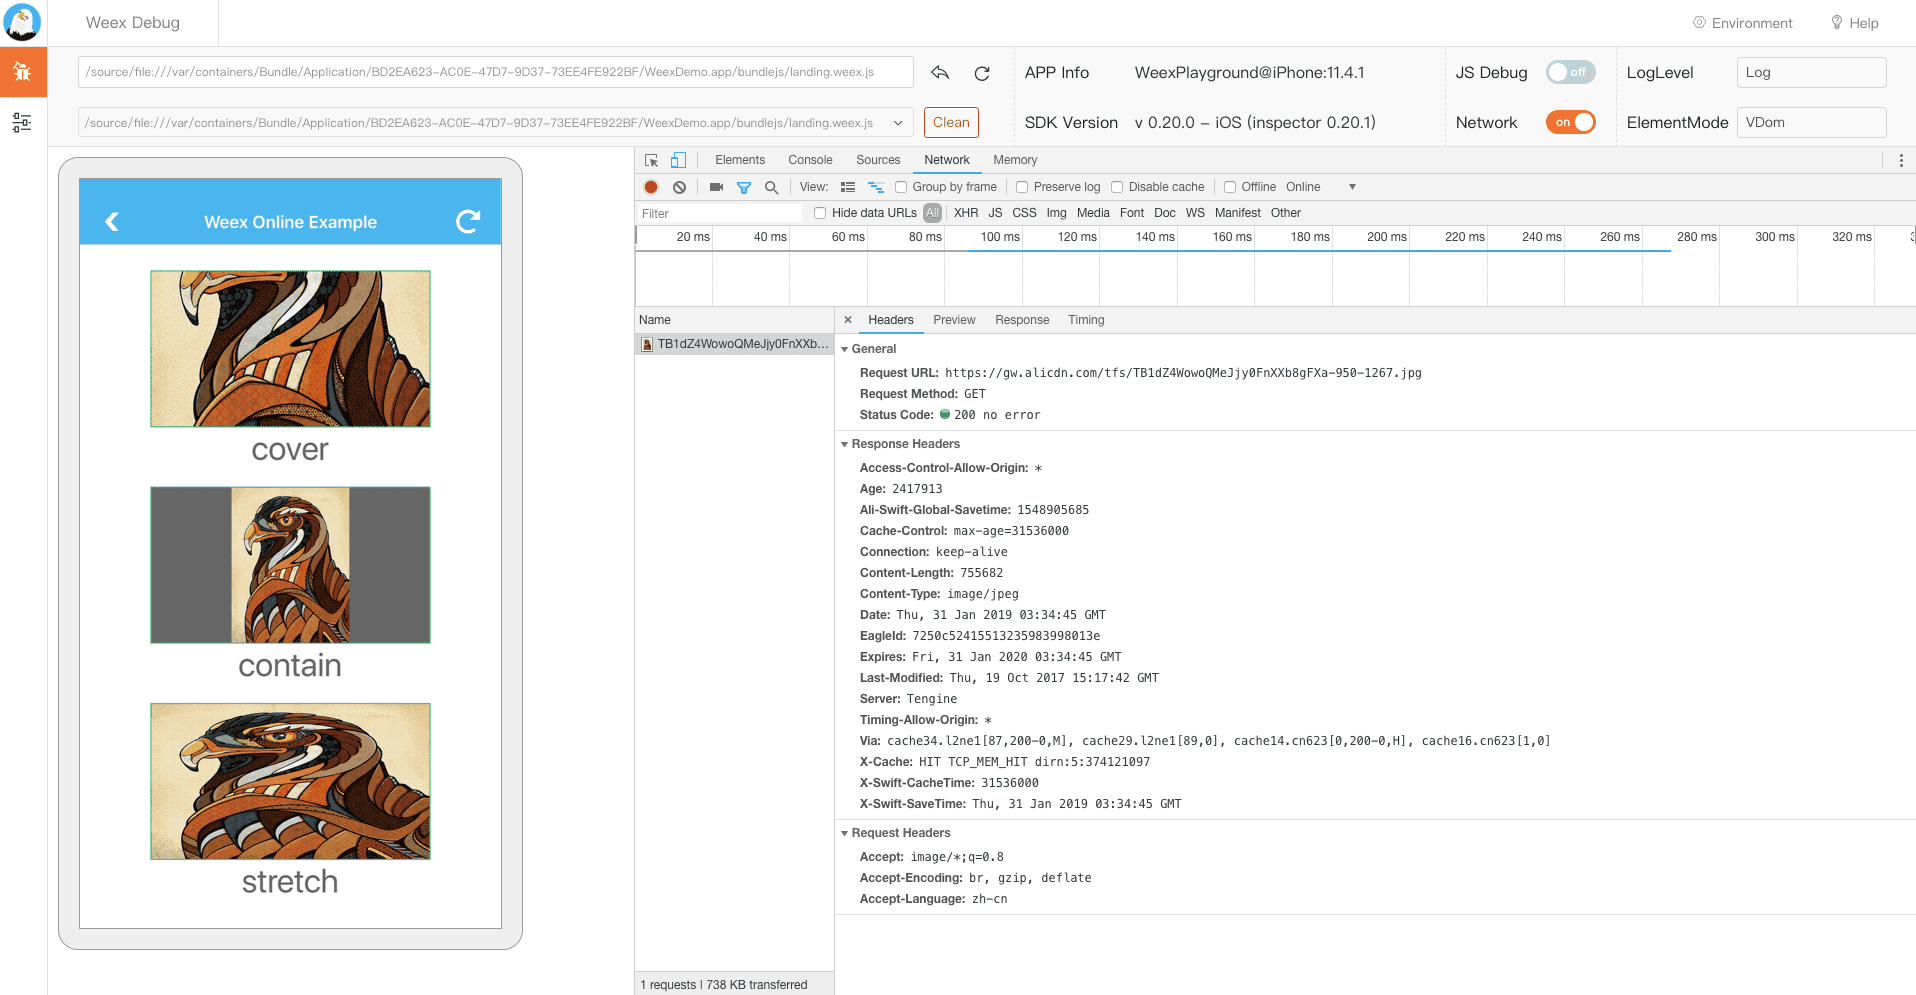
# Network
Open the 'Network' function to view the application's network request information and perform an effective analysis of the page request, as shown in the figure:
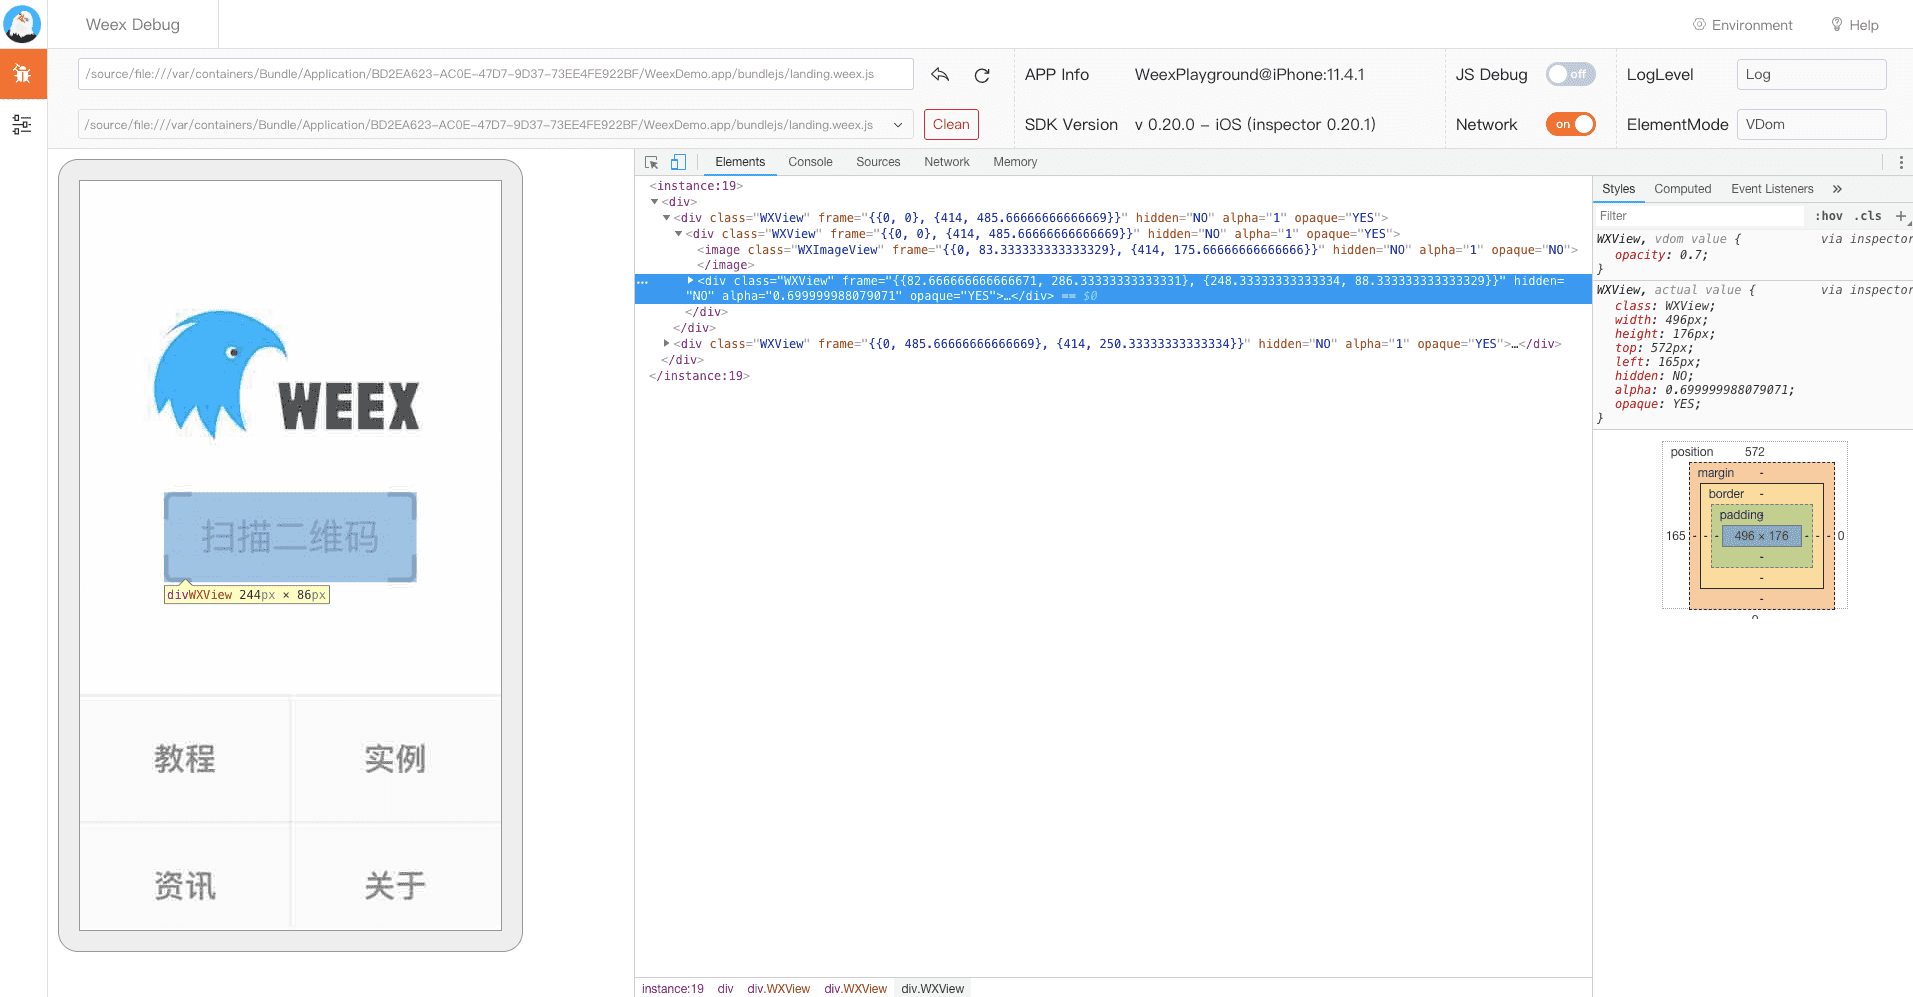
# Element
TIP
In the node review mode, a large amount of page information will be sent. By default, it is enabled. In the case of complicated pages, we generally recommend resetting the station by click this button ![Preview] (https://img.alicdn.com/tfs/TB1S4RVJkvoK1RjSZFwXXciCFXa-30-24.png), otherwise it may affect the speed of JS debugging related functions.
You can switch the display of the current view by selecting the ElementMode option. You can analyze the view level of the page as shown in the figure:
# Extension
The following extension functions need to be enabled in the JS Debug function and are available on the Weex page
# Quick navigation
# File Replacement
Click the Environment Settings menu at the top of the console to modify and replace the dependent files running on the weex page. After the modification is completed, click Generate File -> Change Setting to replace the running environment.
If you have any problems during the use, you can submit the relevant issue to us on here, also you can search for the known issues here.
 Excellent doc